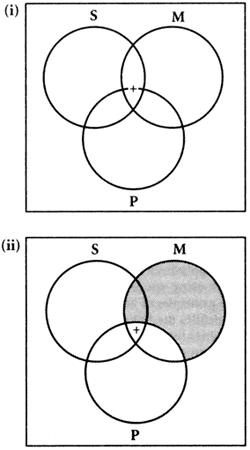
- Venn diagram
- A kind of diagram invented by Venn in 1881, for representing and assessing the validity of elementary inferences either of a syllogistic form, or from the Boolean algebra of classes (Venn was attempting to illustrate Boole's own methods). In a Venn diagram for the syllogism there are three circles, corresponding to S, M, and P. Shaded areas indicate which combinations are empty, and a cross indicates which ones have members, while a cross on a border between two classes represents that at least one class has a member. For example, to illustrate the syllogism ‘Some S is M, all M is P, so some S is P’, the first premise is represented by (i). Here the cross hovers between the area of P and the area outside P. However, the second premise adds the shading of (ii), since any M region outside P is empty. Hence, the cross cannot be there, and is driven into the P area. This shows that some S is indeed P; hence the syllogism is valid. Venn generalized the method. For statements in the algebra of classes involving four terms, ellipses can be drawn, but the method becomes cumbersome. Strips and charts of various kinds were invented in the late 19th and early 20th centuries to give graphical representations of such problems.

Philosophy dictionary. Academic. 2011.
